![]()
|
|
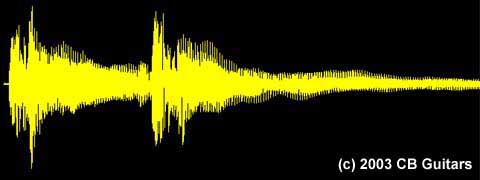
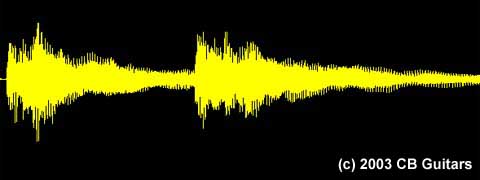
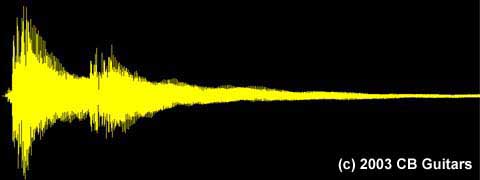
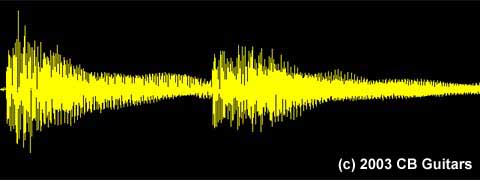
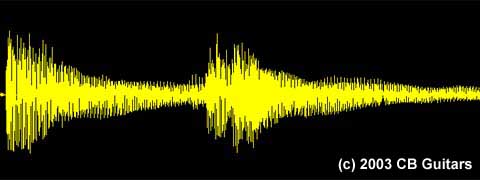
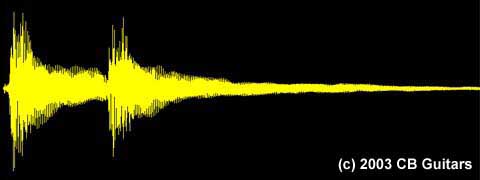
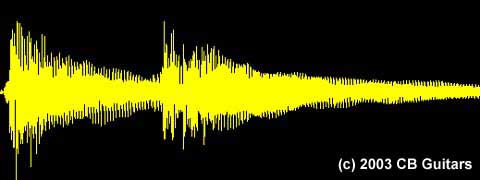
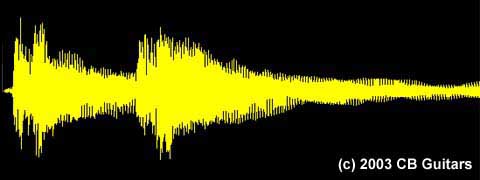
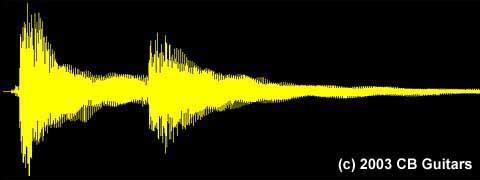
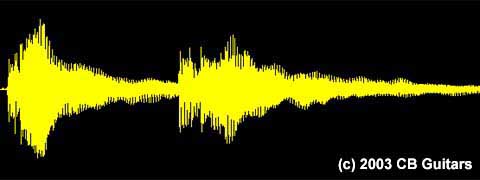
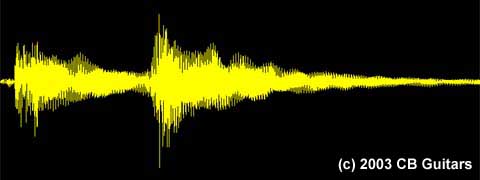
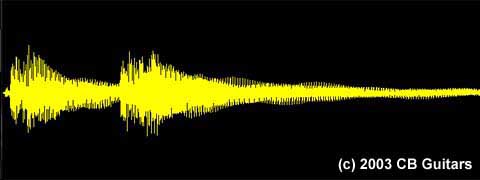
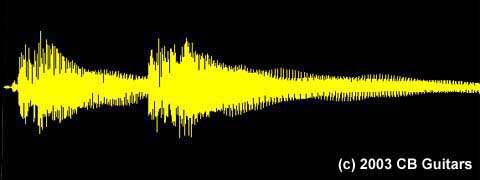
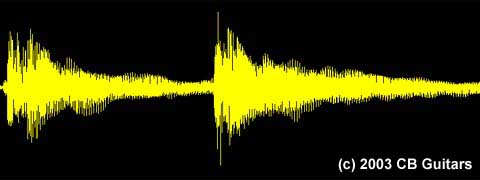
Waveform AnalysisAcoustic waveform analysis is basically a graphic representation of sound, which allows you to see the relative strengths of different tonal ranges, as well as the quickness of attack and rate of decay. The graphs are generated in real time, so as you follow the chart from left to right, you can "see" the sound as it happens; since the chords were strummed in the usual "downstroke" motion (low E to high E strings), you can see the relative strength of each tonal frequency by how wide the "spikes" are vertically. It's really not as complex as it sounds! Below are WAV files of the different "test" guitars being strummed with a G chord by Chris Bozung, each accompanied by a waveform analysis graph of the WAV file. Listening to the WAV file while viewing the graphs should make the waveform analyses easier to understand. Waveform analysis graphs were generated using Creative Labs' WaveStudio software version 4.02.
Next Page - Pictures From The Studio
Last modified: November 28, 2015 |
|
Telephone - 615-799-9217 Postal address - 7151 New Hope Road, Fairview TN 37062 Electronic mail - General Information: info@cbguitars.com
Send mail to webmaster@cbguitars.com with
questions or comments about this web site.
|